Assalaam alaykum,
Please find below yet antother article declaring that global warming is false and absolutely baseless. People all over the world are experiencing an incredibly cold winter, the coldest for years, so the game appears to be well and truly up. All praise be to Allah for exposing the liars and crooks that hold positions in governments and other 'environmental' organisations. Shame on them for concocting such a miserable crock of nonsense for the purpose of inflicting people with carbon taxes (i.e. more of your money to hand over to greedy banks), invading indivudal privacy and removing civil liberties.
All praise be to Allah who told us: "If a corrupt person comes to you with a piece of information then clarify it so that you don't afflict a people out of ignorance and thus come to regret what you have done." [Al-Hujurat 49:6]
If any government official, especially those at the highest level, endorses any sort of cause or campaign, be suspicious. The articles below are two of many that can be found all over the internet.
Last updated January 29, 2009 11:04 a.m. PT
Murdock: Even left now laughing at global warming
DEROY MURDOCKSYNDICATED COLUMNIST
SAN FRANCISCO -- So-called "global warming" has shrunk from problem to punch line. And now, Leftists are laughing, too. It's hard not to chuckle at the idea of Earth boiling in a carbon cauldron when the news won't cooperate:
Nearly four inches of snow blanketed the United Arab Emirates' Jebel Jais region for just the second time in recorded history on Jan. 24. Citizens were speechless. The local dialect has no word for snowfall.
Dutchmen on ice skates sped past windmills as canals in Holland froze in mid-January for the first time since 1997. Defense Minister Eimert van Middelkoop, who inhabits a renovated 17th Century windmill, stumbled on the ice and fractured his wrist.
January saw northern Minnesota's temperatures plunge to 38 below zero, forcing ski-resort closures. A Frazee, Minnesota dog-sled race was cancelled, due to excessive snow. Snow whitened Surf City, North Carolina's beaches. Days ago, ice glazed Florida's citrus groves.
As Earth faces global cooling, both troglodyte right-wingers and lachrymose left-wingers find Albert Gore's simmering-planet hypothesis increasingly hilarious:
"In terms of (global warming's) capacity to cause the human species harm, I don't think it makes it into the top 10," Dr. Robert Giegengack, former chairman of University of Pennsylvania's Earth and Environmental Sciences Department, told the Pennsylvania Gazette. Giegengack voted for Gore in 2000, and says he likely would again.
Commentator Harold Ambler declared Jan. 3 on HuffingtonPost.com that he voted for Barack Obama "for a thousand times a thousand reasons." He added that Gore "owes the world an apology for his actions regarding global warming." He called Gore's assertion that "the science is in" on this issue "the biggest whopper ever sold to the public in the history of mankind."
"Not only is it false that human activity has any significant effect on global warming or the weather in general, but for the record, global warming is over," retired Navy meteorologist Dr. Martin Hertzberg wrote on carbon-sense.com. The physical chemist and self-described "scientist and life-long liberal Democrat" added: "The average temperature of Earth's atmosphere has declined over the last 10 years. From the El Nino Year of 1998 until Jan. 2007, it dropped a quarter of a degree Celsius (0.45 degrees Fahrenheit). From Jan 2007 to the spring of 2008, it dropped a whopping three-quarters of a degree Celsius (1.35 degrees Fahrenheit). Those data further prove that the fear-mongering hysteria about human-caused global warming is completely unjustified and is totally counterproductive to our Nation's essential needs and security."
"It is a tribute to the scientific ignorance of politicians and journalists that they keep regurgitating the nonsense about human-caused global warming," veteran Left-wing commentator and Nation magazine columnist Alexander Cockburn wrote. "The greenhouse fear mongers rely on unverified, crudely oversimplified models to finger mankind's sinful contribution -- and carbon trafficking, just like the old indulgences, is powered by guilt, credulity, cynicism, and greed."
Some leftists believe the collective hallucination of warmism distracts from what they consider urgent progressive priorities:
"The most destructive force on the planet is power-driven financiers and profit-driven corporations and their cartels backed by military might," University of Ottawa physics professor Dr. Denis Rancourt has written. "The global warming myth is a red herring that contributes to hiding this truth."
Social historian Dr. David Noble of Canada's York University concurs. He has lamented that warmism is "diverting attention from the radical challenges of the global justice movements."
Geophysicist Dr. Claude Allegre, previously Education Minister in France's late 1990s Socialist government, denounced the "prophets of doom of global warming." He sounded amused in a September 2006 L'Express article. "The ecology of helpless protesting has become a very lucrative business for some people."
"The so-called 'consensus' on man-made global warming is not holding up," Sen. James Inhofe, R-Okla., told his colleagues Jan. 8. "It is becoming increasingly clear that skepticism about man-made global warming fear is not a partisan left vs. right issue."
So-called "global warming" has accomplished the impossible: It has united liberals and conservatives in laughter.
Deroy Murdock is a columnist with Scripps Howard News Service and a media fellow with the Hoover Institution on War, Revolution and Peace at Stanford University. E-mail him at deroy.Murdock@gmail.com
[The original article can be found at http://seattlepi.nwsource.com/opinion/397959_murdockonline30.html]
Arctic Sea Ice Increases at Record Rate
Arctic Sea Ice Increases at Record Rate
Guest Post by Jeff Id on February 3, 2009
Something I’ve been interested in for the last several months is sea ice data. What makes it interesting is that as I understand it, models demonstrate the poles should be most sensitive to global warming leading the planet temp, especially in the Arctic. Recently I have been able to process the monthly and daily gridded arctic data as provided by NSIDC. The daily values allow a better analysis of trend than can be provided by the monthly data.
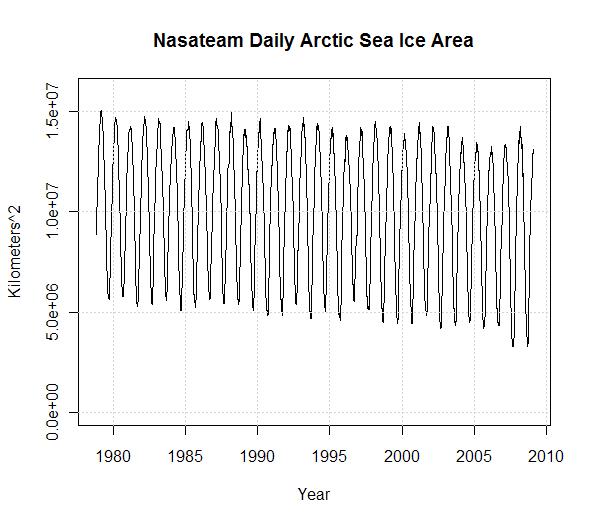
If you’re like me you recall the claims of fastest melt rate ever were made about 2007 , I fully believed them, because the graphs showed a much more negative value than in the previous 30 years as shown in Figure 1 below.
Click for larger image
This effort was originally intended to investigate how bad the melt rate was in comparison to the natural variation, I didn’t get that far yet. Accessing and processing the gridded data was critical to the analysis, so I spent the time reading the literature and writing code. Having full access to the NSIDC data allows some interesting analysis, they do an excellent job on their site.
There are two primary algorithms used for processing ice data NasaTeam and Bootstrap. The descriptions of the data state the difference between the two is very small and the sets are interchangeable except that bootstrap is recommended for trend analysis in research publications. Bootstrap is only provided in monthly data format while NasaTeam is provided in both monthly and daily provided you’re willing to download over 1G of data, write code to process it, refit the land and missing data mask and sum the results. I am. Also, NasaTeam provides a near real time version of the polar ice data which has a different land mask and hasn’t been processed for missing data. This data isn’t as clean but I wanted to use it. I applied the same land mask as the rest of the series to insure that there was a consistent baseline for trend analysis. The missing data from Jan 2008 onward created noise in the series which I simply filtered out using a 7 day sliding window filter.
The mask looks like this Figure 2
The brown is land, black edges on land are coastline and light blue is the satellite data not measured. This mask is applied consistently through the entire data series. There was some question about masking on one of my other posts at WUWT where visually the land area seemed to change size, in the case of the NSIDC data they apply masks consistently except for the satellite hole and the near real time data.
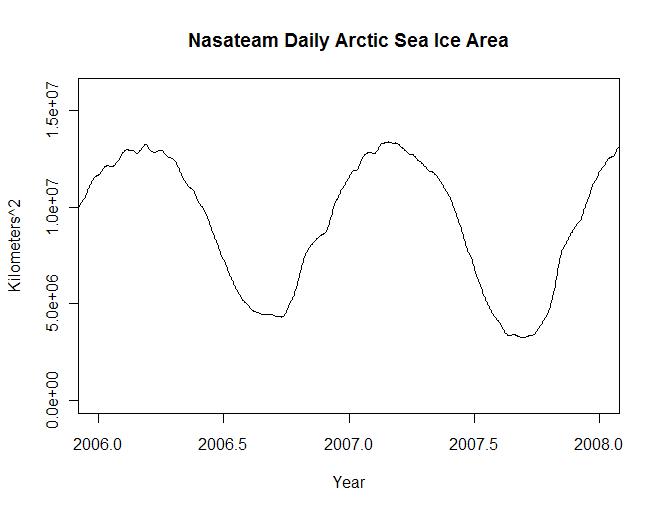
The NasaTeam version of the arctic ice data looks like the plot below for 2009 (note the small size of the satellite data hole). This graph was created in R using the actual Nasa Team masks and data. I used the worst case land and polar masks to adjust the entire dataset to eliminate problems with consistency. Figure 3
Of course it’s an interesting picture, but what I wanted to know when I started this post was how bad was the worst melt rate in history and what is the actual melt area. In the plot below the arctic is losing sea ice at a rate of only 56K km^2/year. Of course sea ice area went up in the Antarctic during the same time frame though. Note the strong recovery in 08 of Figures 1 and 4, which actually exceeds values of most of the record, matching data back to 1980. Much of this is first year ice so the melt in 08 was expected to be a new record.
Click for larger image
If you recall, in 2007 and 08 we were treated to headlines like this, which most of us accepted with a shrug.
Scientists warn Arctic sea ice is melting at its fastest rate since records began
NASA data show Arctic saw fastest sea ice melt in August 2008
Arctic Just Witnessed Fastest August Ice Retreat in History
I processed and analyzed the NasaTeam land area and missing data masks spending hours understanding different variances they list on their own website. After nearly everything I could find (except satellite transitions errors) was corrected (a different post) and corrections for variance in the measured pixel size, the final result in 30 day trends of arctic sea ice looks like the graph below (Figure 5). This graph is a derivative of the ice area plot. The maximum peaks and valleys represent the maximum rates of change in 30 day periods through the ice record.
Click for larger image
Looking at this plot of the 30 day slopes of actual NASA gridded data, the maximum ice melt rate occurs in 1999 and in 2004 not in 2007. Surprisingly the maximum ice growth rates occur in 2007 and 2008, I don’t remember those headlines for some reason. Don’t forget when looking at the 2008 - 09 peak, the data is preliminary and hasn’t been through the same processing as the other data. From looking at the unprocessed data I doubt it will change much.
Certainly the 30 year arctic trend in ice area is downward, even the most committed global warming scientist has to admit this happens regularly in climate along with regular 30 year uptrends. The questions are, did we cause it or not, and was CO2 the instigating factor. The rapid recovery of ice levels has to have some meaning regarding the severity of the problem. This goes directly in the face of accelerated global warming and the doom and gloom scenarios promoted by our politicians and polyscienticians.
Why are my conclusions different from the news reported records? I think it’s likely due to the fact that the scientists used the monthly data which is processed using a weighted filter of the daily data that incorporates a longer time frame than a single month. This means their use of the monthly data to establish a monthly trend was in error and the real record down trends were actually set in 1999, 2003 and 1984. While the record uptrends were in 2007, 2008 and 1996.
[The original article along with the charts and diagrams can be found at http://wattsupwiththat.com/2009/02/03/arctic-sea-ice-increases-at-record-rate/]